
Technology leadership diagnostics
Engineering Velocity Declining? A Diagnostic Guide
Diagnose declining engineering velocity through work timelines, review queues, interruptions and delivery evidence. Choose a bounded improvement experiment.
- By
- Fractional CTO Experts
- Published
- 2026-07-30
- Reviewed
- 2026-09-07
- Reading time
- 14 minutes
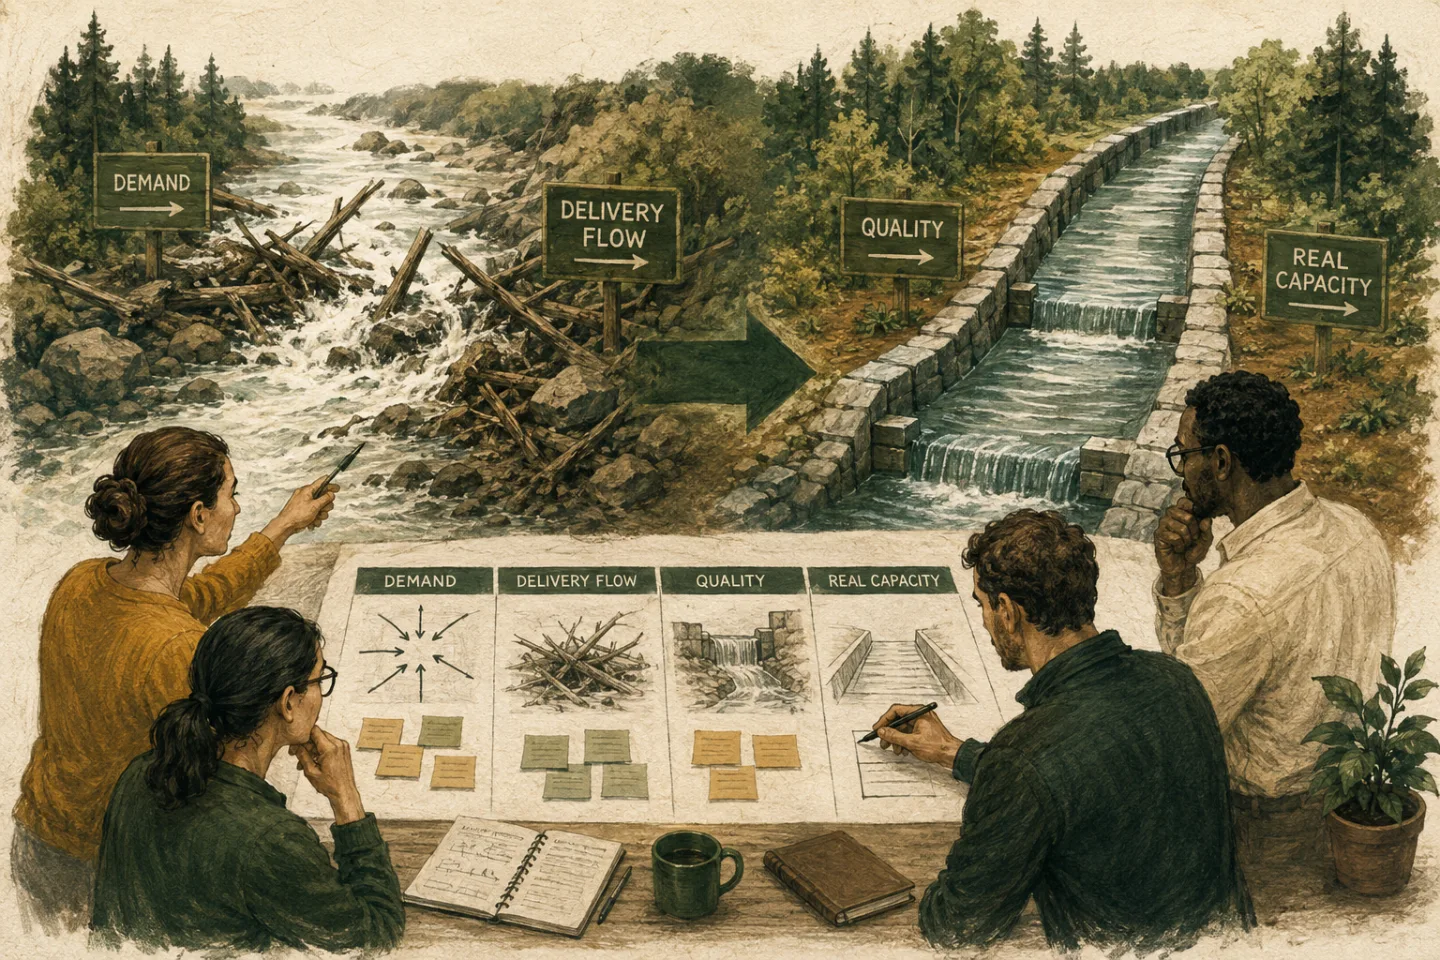
When engineering velocity is declining, asking developers to move faster can make the system worse. Delivery speed emerges from demand quality, decision authority, architecture, team design, environments, feedback, operational load, and the amount of work in progress. The visible slowdown may be a rational response to hidden complexity.
A CTO-led diagnosis should trace real work, separate waiting from building, connect speed to customer outcomes and reliability, and run a bounded experiment against the most important constraint.
- Define the change you observed
- Trace work from demand to use
- Diagnose the system causes
- Stabilize demand and work in progress
- Run one constraint experiment
- Use balanced measures
- Make technical investment explicit
- Address organization and management
- A 45-day recovery sequence
- Start with a timeline of one delayed change
- Separate a planning measure from an outcome measure
- Inspect the work that never appears in the roadmap
- Run a review-queue experiment
- Decide when technical debt needs dedicated investment
- Examine management load before reorganising teams
- Make forecasts reflect uncertainty and capacity
- Questions about declining engineering velocity
- Restore leadership, not pressure
Define the change you observed
“Velocity feels slow” is not yet evidence. Describe:
- what used to happen and what happens now;
- which work or teams are affected;
- whether customer outcomes, releases, response, or estimates changed;
- the time period and business events around it;
- changes in team, product, architecture, quality, security, or support load.
Avoid comparing story points across teams or periods as if they were standardized output. Changes in estimation, scope, team composition, and quality expectations can move the number without changing value delivered.
Trace work from demand to use

Select several recent meaningful items and reconstruct:
- when the need became visible;
- how long it waited for priority;
- how much changed before work began;
- build time and interruptions;
- review, testing, and correction;
- environment and release waiting;
- time until customer use;
- defects, support, and follow-up.
This separates active work from blocked time and rework. A team may spend two days implementing a change that waits three weeks for a product decision and another week for coordinated release. Optimizing typing cannot solve that.
Diagnose the system causes
Common interacting causes include:
Demand: priorities change, too much work starts, acceptance is unclear, or customer commitments bypass planning.
Decisions: founders, product, security, or architecture approvals create queues; teams lack local authority.
Dependencies: several teams or vendors must coordinate for an ordinary change.
Architecture: tight coupling, unclear ownership, poor testability, and risky deployments increase change cost.
Quality: escaped defects, incidents, and support consume capacity and confidence.
Environment: builds, test data, access, and deployments are slow or inconsistent.
People: onboarding, vacancies, manager overload, burnout, conflict, or fear reduce effective capacity.
Investment debt: the company repeatedly postpones platform, tooling, simplification, and risk work, then pays through every feature.
Do not label all structural friction “technical debt.” Name the actual decision and consequence. Some complexity is necessary for the business; some was an appropriate earlier shortcut; some persists because ownership and economics were never reviewed.
Stabilize demand and work in progress
Choose a small number of outcomes and stop starting work that cannot be finished. Make an explicit priority owner available to resolve questions. Break work into increments that can reach a user or safe production boundary.
For a recovery period:
- protect the current highest-value work from casual interruption;
- create an urgent path with an actual urgency definition;
- limit simultaneous work;
- resolve acceptance and key design questions early;
- surface dependencies before commitment;
- review blocked work daily;
- close or deliberately stop stale items.
This is not a permanent command-and-control system. It is a way to make the constraint visible and restore a credible feedback loop.
Run one constraint experiment
Write:
- Hypothesis: what condition is creating the most delay or rework.
- Action: one change the team can run for two to four weeks.
- Signal: what should move if the hypothesis is correct.
- Guardrail: what must not deteriorate.
- Review: the date and decision after the experiment.
Examples:
- If review queues are the constraint, distribute ownership and set smaller change limits; inspect wait time and escaped defects.
- If environment inconsistency causes rework, standardize the highest-friction path; inspect setup time, failed builds, and support.
- If interrupt load is the constraint, rotate a protected response owner; inspect focused work, response, and team load.
- If architecture coupling is the constraint, isolate one high-change boundary; inspect lead time and incident impact for that area.
Avoid launching a transformation portfolio before proving which changes affect the bottleneck.
Use balanced measures
Combine:
- customer or business outcome evidence;
- lead and cycle time for meaningful work;
- deployment and release evidence;
- defects, incidents, and recovery;
- blocked time, rework, and dependency load;
- roadmap investment progress;
- team capacity, retention, and sustainable workload.
Metrics are conversation inputs. Targets can produce gaming when people fear the consequences. Ask what changed in the system, which tradeoff was made, and whether the measure still represents the desired outcome.
Speed without reliability can shift work into support. Reliability without product usefulness can optimize a system customers do not need. Team health without clear outcomes can feel comfortable but directionless. Leadership balances the set.
Make technical investment explicit
When a platform constraint affects every change, fund it as a business investment. Define the current cost, target capability, option set, accepted scope, owner, milestones, and acceptance evidence.
Avoid “twenty percent for tech debt” without prioritization. Some work should be integrated into ordinary changes; some deserves a focused program; some can remain because the cost of removal exceeds its impact. The CTO translates these choices into business terms.
Address organization and management
Delivery decline can reveal managers with too many reports, unclear team ownership, technical leaders trapped in approval, or product and engineering operating as client and supplier.
Before reorganizing, map:
- decisions and where they wait;
- outcome ownership;
- cross-team dependencies;
- manager and technical-lead load;
- customer and operational responsibility;
- missing capabilities.
Change roles or structure only where it will move authority, information, or capacity to the constraint. A new box on an organization chart does not shorten a deployment.
A 45-day recovery sequence
Days 1–10: define the observed change, trace real work, identify current incidents and interruptions, and stabilize priorities.
Days 11–25: choose the primary constraint experiment, fund it, protect the team from conflicting changes, and review balanced signals.
Days 26–45: inspect results, keep or reverse the change, fund the next constraint, and make ownership part of the normal cadence.
A fractional engineering manager fits when the gap is team-level cadence, coaching, and delivery ownership. A fractional CTO fits when the constraint crosses product strategy, architecture, investment, risk, organization, and executive decisions.
Start with a timeline of one delayed change
A useful delivery investigation begins with a real item rather than a debate about whether the team works hard enough. Choose a change that mattered to a customer or the business and reconstruct its path from request to use. Include the periods before development started and after the code was considered complete.
In an illustrative example, a reporting change takes fifteen working days to reach users. The initial request waits four days for a priority decision. Development takes three days, a business-rule clarification adds two days of waiting, review takes another three days and the release queue adds three. The arithmetic describes a hypothetical case, but it shows why total elapsed time can be much larger than implementation time.
Ask which delays were necessary and which were avoidable. A review may have found a genuine permission risk; removing it would not be an improvement. The opportunity might be to surface that requirement earlier or make the review smaller and easier to perform. Treat each stage as a source of evidence, not a target to eliminate automatically.
Repeat the exercise for several different items. A single example can reveal a mechanism, but it cannot establish that the same mechanism dominates the whole team. Record how the sample was chosen and include work that went well. Successful examples often show practices worth extending.
Separate a planning measure from an outcome measure
Story points can support a team's planning conversation when the team understands what they mean. They are not a common unit of business value or a reliable way to compare different teams. A change in estimation conventions can move reported velocity while the customer experience remains unchanged.

Use clear definitions for the question being investigated. Lead time might begin when a request is accepted, while cycle time might begin when active work starts. The definitions are useful only when they are explicit and applied consistently. If a team changes its workflow states, explain how that affects comparison with earlier periods.
DORA's guide to software delivery performance metrics currently describes five measures covering throughput and instability. These provide a structured reference for software delivery, but they do not replace product-outcome evidence or establish an individual's productivity. Choose measures at an appropriate service or team boundary and interpret them alongside the work being delivered.
A useful review can combine elapsed time, waiting time, defects and evidence of customer use. If lead time improves because the team completes smaller meaningful changes, that may be helpful. If it improves because difficult work is excluded or tickets are closed before acceptance, the measure is no longer answering the intended question.
Inspect the work that never appears in the roadmap
Support, incidents, customer escalations, security updates and internal requests can consume substantial capacity without appearing in the planned delivery total. If the team is judged only on roadmap output, this work becomes invisible or is treated as a personal failure to stay focused.

For a short observation period, classify interruptions by source and purpose. Record whether they were urgent, who could prioritise them and whether they were recurring. Avoid demanding minute-by-minute surveillance. The objective is to understand competing demand well enough to make a management decision.
A recurring customer issue may justify a permanent product correction. A stream of small internal requests may need a service boundary and response policy. A serious incident may require an immediate diversion of capacity and a revised roadmap commitment. These are different responses; grouping them all as distractions prevents useful action.
Ask which work the company is prepared to stop or delay. A team cannot simultaneously protect a plan and accept unlimited additional priorities. Make the tradeoff visible to the person with authority to decide, and update external commitments when necessary.
Run a review-queue experiment
Suppose the evidence suggests that changes spend most of their time waiting for one senior reviewer. The first experiment might distribute review ownership for a defined component and make changes smaller. It should include the standards and support that allow another reviewer to make a safe decision.
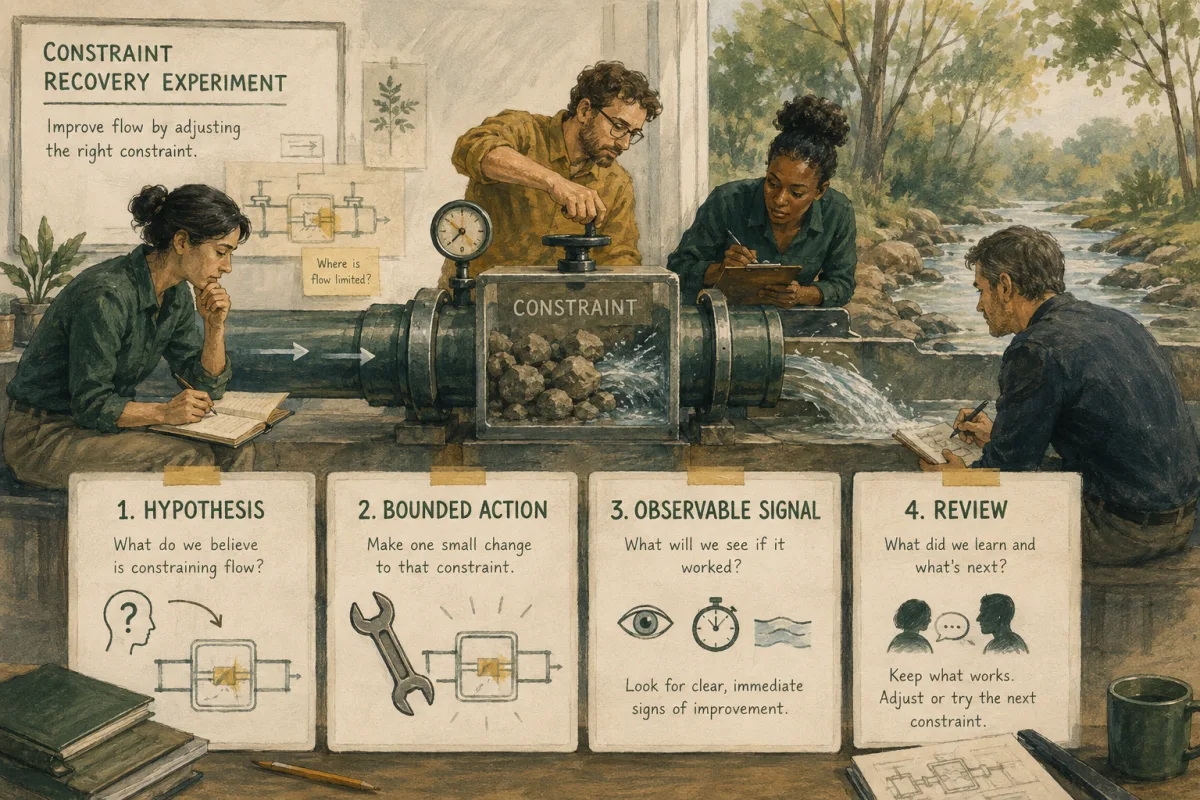
Define the scope and duration before starting. For example, the experiment could cover ordinary changes to one service over the next delivery cycle. High-risk permission or payment changes might retain an additional specialist review. The distinction should follow the consequences of the change, not a blanket desire to remove checks.
| Experiment element | Example definition |
|---|---|
| Hypothesis | Review concentration is creating avoidable waiting |
| Change | Train a second reviewer and reduce the size of ordinary changes |
| Primary evidence | Time from review request to useful feedback |
| Quality check | Defects or rework discovered after acceptance |
| Capacity check | Total review effort and load on both reviewers |
| Decision | Keep, adapt or reverse the arrangement after reviewing fresh work |
Discuss the results with the people performing the work. If waiting falls but review effort doubles because the new reviewer lacks context, the next step may be better documentation or a clearer boundary. An experiment that produces mixed results can still improve understanding. Do not describe it as a failure merely because the original hypothesis was incomplete.
Decide when technical debt needs dedicated investment
Technical debt is most useful as a discussion of specific consequences. Identify which part of the system increases change effort, incident exposure or operating cost, and show representative evidence. A general claim that the code is old does not establish that a rewrite is the best response.
Compare several options: improve the tests around the current behavior, simplify a component, isolate a frequently changed boundary, replace a dependency or accept the present condition for a defined period. Explain the cost and limits of each. The appropriate choice depends on future demand as well as current pain.
For an illustrative high-change module, the team might first add characterization tests and extract a clearer interface. That could reduce risk sufficiently without replacing the whole application. If the problem instead lies in an unsupported dependency with unacceptable exposure, a more concentrated migration may be necessary. The evidence should determine the intervention.
Define acceptance in terms of capability. Can the team change the module with less coordination? Can it detect the relevant failures? Can another engineer understand and operate it? Counting refactored files or celebrating a new framework does not answer those questions. The legacy-modernisation guide develops the options and transition considerations.
Examine management load before reorganising teams
A manager with too many competing responsibilities may become an approval queue, even if the team structure looks reasonable on paper. Inspect the decisions that wait for that person and which could be delegated. Also consider whether they have enough support for hiring, coaching and operational work.
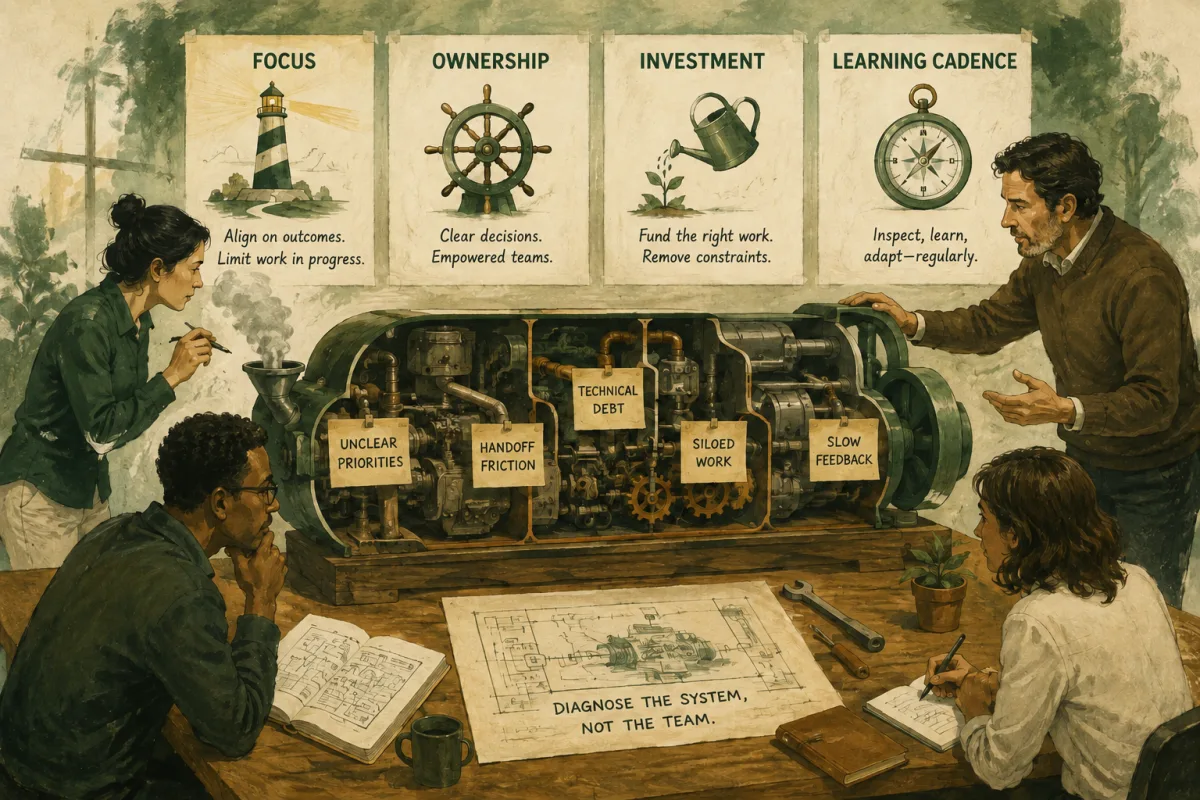
A reorganisation can help when it gives a team clearer ownership of a meaningful outcome and reduces dependencies. It can create new problems when the same work still crosses the same systems but now requires introductions to different people. Map the expected change in decision flow before moving reporting lines.
Ask teams to describe where they need another group's permission, environment or specialist knowledge. Some dependencies are necessary and should be served reliably. Others can be reduced through clearer interfaces, training or a different scope. The objective is workable autonomy, not complete isolation.
After a structural change, observe the actual work again. Compare the coordination burden, decision delays and operating results with the intended improvement. Keep the ability to adjust the design instead of defending the new chart as a finished transformation.
Make forecasts reflect uncertainty and capacity
A delivery forecast should explain what is known, what remains uncertain and which assumptions could change the date. Distinguish work with a well-understood implementation path from work that still requires discovery. Treating both as equally predictable produces false precision.
Discuss scope options when a date is important. A smaller useful release may be possible while a broader capability remains uncertain. Identify dependencies outside the team's control and agree when a decision or external contribution is needed. A forecast without those conditions can become a promise nobody was equipped to keep.
Include operational and support demand in capacity planning. If recent incidents have repeatedly interrupted the team, assuming an uninterrupted future period requires justification. Explain what has changed or preserve room for that demand. The point is to support a credible business decision, not to make the plan appear more conservative by default.
Review forecasts against outcomes without turning the comparison into blame. Ask which assumptions were wrong and how the next forecast can represent them better. Repeated unexplained slippage deserves investigation, but fear-driven reporting can hide uncertainty until it is too late to act.
Questions about declining engineering velocity
Should we hire more engineers to improve velocity?
Hire when evidence shows a capacity or capability gap that additional people can realistically address. If work is waiting for product decisions, a shared test environment or one reviewer, adding engineers may increase the queue. Establish the main constraint and account for onboarding before assuming headcount will translate directly into faster delivery.
Is technical debt always the cause of slow delivery?
No. Unclear priorities, acceptance changes, interruptions, review queues and organisational dependencies can have a similar visible effect. Trace actual work and name the mechanism. Technical debt may be part of the explanation, but it should not become a catch-all label for every management or process problem.
Can AI coding tools solve declining velocity?
They may help with some implementation tasks, but the effect depends on the work, review requirements and surrounding system. If the main delay occurs before coding or after review, faster code generation may have little effect on customer lead time. Evaluate a bounded use case with quality and operating checks rather than assuming a tool will remove every delivery constraint.
What should we measure first?
Start with the elapsed path of representative work and the customer outcome it was intended to support. Identify waiting, rework and interruptions. Add formal metrics once the definitions and boundaries are clear enough to interpret. A small reliable evidence set is more useful than a dashboard of numbers nobody can explain.
How soon should improvement be visible?
Some changes, such as clarifying a review owner, can affect the next few items. Architecture or staffing changes may take longer and introduce transition costs. Agree the observation period and expected signals for the particular intervention. Do not promise a fixed percentage improvement within a universal number of weeks.
When should leadership bring in external help?
External support can be useful when the constraint crosses executive boundaries, the internal team lacks assessment capacity or repeated attempts have not produced a clear diagnosis. Choose someone who can inspect work and explain tradeoffs with the team. A useful engagement leaves internal ownership and a repeatable improvement process.
Restore leadership, not pressure
Leaders improve the system by clarifying outcomes, reducing conflicting demand, moving decisions to the right level, funding structural constraints, protecting quality, and learning from evidence.
The goal is not maximum visible activity. It is a sustainable ability to turn a business decision into reliable customer value, with less waiting, rework, and dependence on heroics.
Frequently asked questions
Why is engineering velocity declining?
Possible causes include expanding demand, interruptions, large work batches, dependencies, unclear decisions, quality rework, fragile architecture, onboarding load, weak environments, or unsustainable team conditions.
Should we measure developer productivity by story points?
No single activity measure represents productivity. Story points are local planning aids and can be gamed. Combine customer outcomes, flow, quality, reliability, investment progress, and team health with context.
Will hiring more engineers improve velocity?
Only if capacity is the limiting constraint and the organization can onboard and coordinate the new people. Hiring into unclear priorities, brittle systems, or decision queues can slow delivery further.
When should we hire fractional engineering leadership?
Use it when delivery and team-system decisions are consequential and recurring, internal authority is insufficient, and a bounded leader can install stronger ownership before a permanent hire or transition.
Sources and further reading
Turn research into a mandate
See the cost and hiring model before you shortlist.
Use the free calculator, then save a candidate search or post a transparent role when the mandate is ready.